Why is A/B Testing Crucial for Your Business?

Every company wants its content to be effective. We want to be assured that what we say and what we create matters to the right people, helps them and creates a special experience with our businesses. But how do you know what will work and what won’t?
The field of communications has always been largely about research and testing. In the old days, we had surveys, in-depth interviews, and focus groups. All of these methods continue to be relevant. But with the development and eventual dominance of the digital world and digital communications, we have more opportunities and tools for research and experimentation. And these tools require less effort, are faster, and most importantly – are accurate being based on real world data.
A/B tests are probably the most recognizable type of experiment as well as the easiest to run and measure. In fact, it is believed that the first A/B tests were carried out not even in the digital, but in the physical world – when two versions of a discount coupon were printed in the newspaper, and then it was calculated which of them brought more buyers.
In this article, based on “The complete A-Z of A/B testing: How to run profitable digital experiments” by Jessica Hutchinson and Michiel Dorjee of Optimizely, we’ll look at the digital application of A/B tests – what it is, where to start your first experiments and what common pitfalls to avoid.
What is A/B testing?
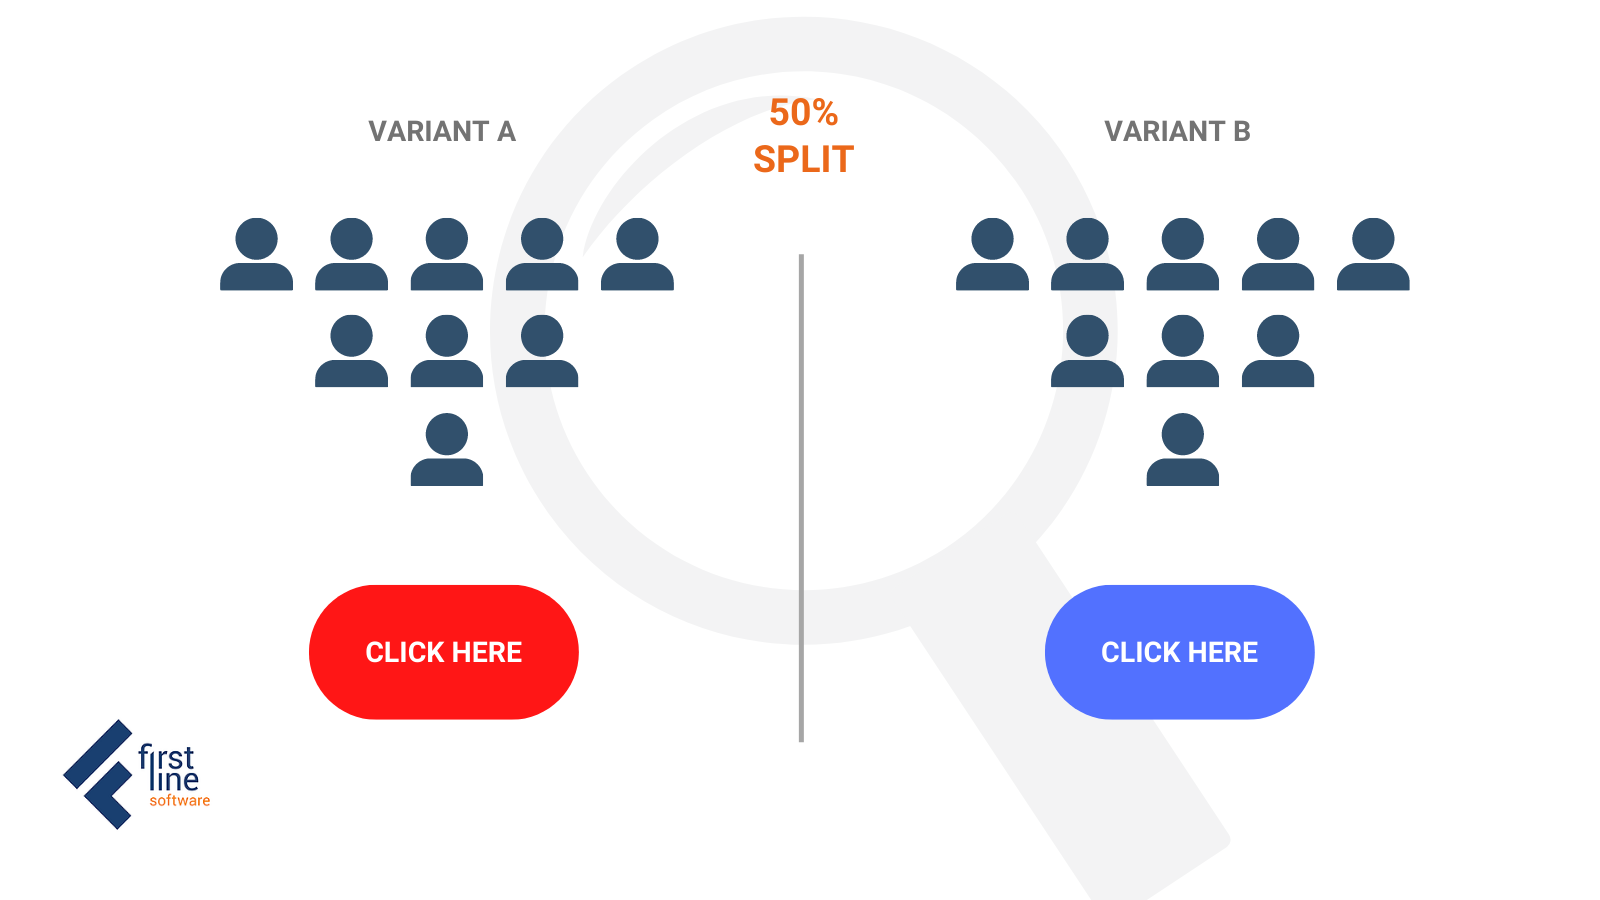
The mechanics of A/B tests are quite simple. You have 2 groups of people and 2 variations of what you will show them – A and B. You assume that one of the variations may perform better than the other and bring you more efficiency. But at first glance, it is not obvious to you which option is better. Or you need accurate data to approve one of them. This is where you start testing.
The simplest example would be the color of a CTA button – you want to discover which will convert better – red or blue.
You start the experiment and show one group a red button, and to another a blue button. After a certain amount of time you’ll reach statistical significance (we’ll talk more about that later). Then you measure the performance of each variation and make a decision. Or you can keep testing and try yellow.
If you and/or your colleagues have opposing ideas – A/B tests are one of the best options to test and prove or disprove them based on real world data, not subjective preferences.
Not only A/B
In fact, you can go further and create not only 2 variations, but as many as you need – A, B, C, D, etc.
You can create variations on multiple objects and see how different combinations work. But keep in mind that measurements in such an experiment will become more complicated.
In addition, you are not limited to just websites – A/B tests are successfully carried out in mobile applications, servers, and as we mentioned above, in the physical world.
What to test?
So you’ve decided you’re ready to experiment. How to determine where to start testing?
Often companies start working with the blocks that are directly related to conversion – an application, purchase form, or demo session booking.
But this may not always be the first step. Users who have reached the submission of an application may already be quite interested in your product or service. In addition, there might not be many people at this deep stage of your conversion tunnel, so it will take you a long time to get enough data.
This isn’t to say that testing isn’t worth doing here, but what you need to do initially- is to think carefully about the journey your potential customers take.
To prioritize your ideas – determine how impactful they will be? How can they change the entire user journey?
4 things to keep in mind when prioritizing your testing ideas:
- How many people will see it?
- Is it above or below the fold? (Yes, it’s still relevant!)
- Is it significant enough? There is no point in testing superficial things, most likely you will not see any noticable difference between your variations and will simply waste your time. If your experiments do not show interesting results – most likely it’s not significant enough to test.
- Experimentation is no excuse for bad ideas. If at the initial stage you doubt the idea, there is no point in testing it. It is better to spend the effort and time to come up with variations that are equivalent in your opinion and work with them.
Another thing to remember when testing is that failure can also be success. If all our tests were successful, most likely we would not need them at all. In this case, we would be smart enough to just immediately launch all our ideas into production without experimentations.
When to start measuring results? Significant significance
To start measuring results and coming to conclusions, we need to reach significant significance. It makes us sure that the numbers we see are the right ones, they are stable over time, and the formulas work out in the favor of a certain variation.
Generally it is advised to go between 95-97% statistical significance, running your experiment over time and letting the system measure different metrics between the versions.
How long this will take depends on each specific experiment you are doing. How many people and how often do they see the place where you are testing, what metrics you want to measure, and what other circumstances affect the experiment.
False positives
Other circumstances that can affect your results are the things you should be careful about, because they can give you either false positives or negatives and invalidate the experiment.
For example, if you measure the “add to cart” button for an ecommerce website during the Winter Holidays shopping week, the period of time will definitely affect the way people behave and you’ll see peaks that are not reflective of the off-season shopping period.
You need to plan your time and look at market stability to measure correctly.
But there is good news… Some systems like Optimizely DXP for example can recognize those variables, make you aware of them, and help with correct conclusions.
How to set up your first experiment
When setting up your first test, try to use the good old 5W’s – What? When? Where? Why? And How?
To answer the question: “What?” – think about the main purpose of your site. From here, you will understand which activities will be the most important to track and experiment with.
If you’re running a blog, engagement is important to you – you’ll probably want to look at the depth of view of certain articles.
If you offer services or products of your company – most likely you will end up interested in submissions – which means clicking on buttons or links.
If you run an e-commerce website, you probably would focus on product views, cart additions, and successful purchases.
Keep in mind the further into your digital domain we conduct tests at – the less people will reach it – the longer it will take to reach any statistical significance.
Start with the metrics
Thinking about metrics and how you’re going to track things before you actually start experimenting should be where you begin.
You need to know where the most impactful places are to make changes.
Create a separate document and list out all the actions a certain user can take. Describe in as much detail as possible all the options of the journey that they can go through. Every click or keystroke has a trackable event and can be measured.
- Write all of the options out
- Assign weights (which of those are more or less important to your business goals)
- Implement them on your tracking tools. Google Analytics, for example.
- Look at the data from your tracking tools over time. Maybe you’ll see some different audiences you’ll want to split in further experiments. Maybe you’ll notice the areas of engagement frustrations – these will be good places to test at.
The simplest experiment to try
To try your first test, consider experimentation with headlines on your homepage.
Create multiple variations – more straightforward, more friendly, more actionable. Don’t forget- these should be significant enough to achieve something interesting.
Try to pick just one variation against the original and keep testing over time until you’ll find the one that will outperform the existing.
From that you can keep on swapping the b variant and test until you feel that there’s no optimization to be had.
And then start testing somewhere else.
Hypothesis – what is it and how to come up with one?
A hypothesis is what should underlie your experiment and answer the question “Why”.
Always remember that in the end, you should not just think about colors and buttons, but about the value that changes can bring to your users. Making a hypothesis will help you stay on course.
The formula is
If____then_______because______________
If we do X – Y will happen, because of Z
For example: By changing the headline on the contact us page to, “Request Pricing” we believe it increases the conversion rate because we see people dropping off.
Study the behavior of your visitors, think about their motives, emotions and goals at different steps. Is there anything you can fix and expect the behavior to change? Bring it to the hypothesis.
In fact, the best hypotheses don’t just describe the exact changes. They give reasoning behind the changes and their ideology – so you can think of multiple solutions and experiments that would fit.
How to read the results
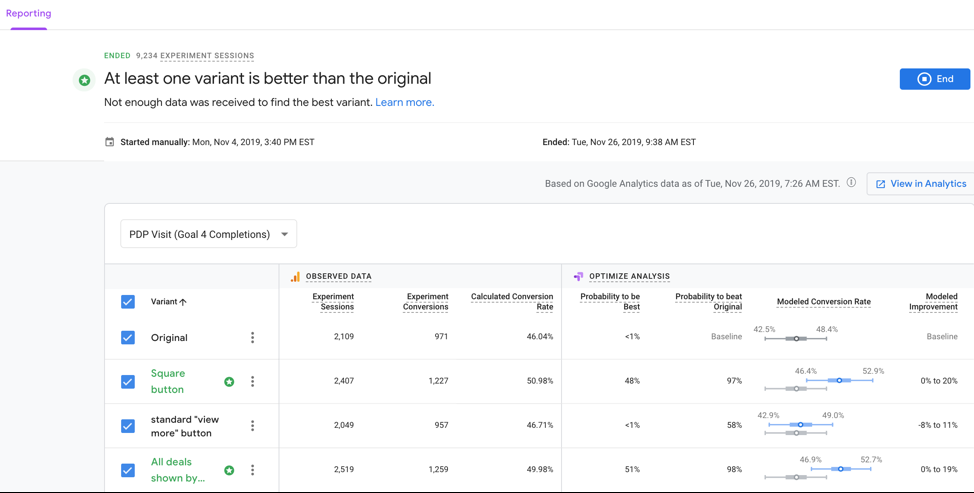
Let’s go further. You’ve run your first test, you’ve reached the significance level, how do you read the results?
Regardless of the tool you are using, you will most likely see the same picture. You get different variations listed out – if you’re running an A/B test you’ll have a single line for each variation and the primary metric you picked to measure.
If you want to keep track of circumstantial things or you know that certain metrics feed into each other – you can have multiple metrics on your dashboard. For example, if you’re running an ecommerce website you have, “product views” – “add to carts” – “purchases” – you might want to see the impact for all of these 3 – We call it a funnel test.
If you’re running a multivariate test, where you give a system multiple components – headline, CTA, image or description – you will see how those play together – variations like ABA. ADC, etc.
The tool you’re using will show you which of the variations outperformed the other on which metrics. From here you can decide what to do next…
Common pitfalls – what do you have to be aware of
It’s very likely that when you start experimenting, you’ll encounter some errors or difficulties. This is to be expected, just keep going and you’ll see the results.
Here are a few things to keep in mind to stay focused:
- Don’t test ideas that you already don’t believe in – you don’t need to waste time on that. You can always find another variation “equal” to the original. If you can’t – consider some other place to experiment.
- Don’t be overwhelmed by the amount of experiments – think of a framework on how you’re going to prioritize your ideas – the more mindful you are upfront before you start, and knowing how you want to read the results – the better the results are going to be.
Always remember – the goal is not to test every minor feature like italic or bold inscription, or the size of a font – but to try really new things and search for desired outcomes.
What’s next?
Now you’re ready to start your first experiment. Or maybe you already have some experience?
Our highly experienced team of testing professionals is always ready to discuss what you can achieve with A/B testing and provide you with the right technical tools for your success.
Talk to us today!